/
The Software Engineering Insights Alternative to Jellyfish
Improve developer productivity by up to 30% with Opsera, the Enterprise-ready software engineering intelligence platform alternative to Jellyfish. Gain actionable data and insights with more than 100 KPIs, developer experience and productivity metrics including GitHub Copilot and DORA, and unified insights across all teams, tools, and cloud environments including SaaS applications like Salesforce.

Choose the Right DevEx Metrics, Developer Productivity, and DevOps Insights Solution
Streamline your software development lifecycle (SDLC) by consolidating data from more than 80% of the top DevOps tools and platforms into a single, centralized dashboard and eliminate the need to switch between fragmented interfaces. Gain a holistic view of the entire development process, from code commits to deployments. This singular view empowers your teams to pinpoint bottlenecks, identify areas for improvement, and make data-driven decisions to optimize developer productivity and release velocity.
| Jellyfish | ||
|---|---|---|
| Processing and Contextualizing logs | ||
| Pipeline compliance KPI’s | ||
| Governance KPIs | ||
| SLSA Framework KPIs for supply chain | In Progress | |
| DORA Metrics | ||
| GitHub Copilot Reporting with Individual Developer Data | ||
| Actionable Intelligence | ||
| SaaS & COTS KPIs | ||
| IAC KPIs | ||
| User Defined Goals | Maybe | |
| Configurable time frames for KPIs | ||
| Correlation with CAR Data | ||
| Integration with different SAST, DAST and Container Scanning tools | ||
| Integration with planning tools such as Jira, Rally | ||
| Integrations with ITSM tools such as Servicenow | ||
| Integration with different tools using CAR Data | ||
| Tool specific KPIs and reports | ||
| Customized views based on personas | ||
| Pre-defined widgets on critical metrics | ||
| Blueprints to view raw console logs | ||
| Integration to Testing tools (Junit, Jmeter, Sauce labs, Selenium, provar, etc) | ||
| Advanced tagging mechanisms | ||
| Integration to Git | ||
| Integration to Collaboration tools – alerts & notifications for anomalies (Slack/Jira) | ||
| SOC2 Type 2 | ||
| Customer Data Security | ||
| Identity & Access Management | ||
| Ability to scan and identify secrets stored in repositories | ||
| Strategic Threshold Management | ||
| Slack notification for KPI Thresholds | ||
| Advanced tagging mechanisms |
One DevOps platform for all your teams
End-to-end DevOps visibility, CI/CD pipeline orchestration and shift left security.
Insights
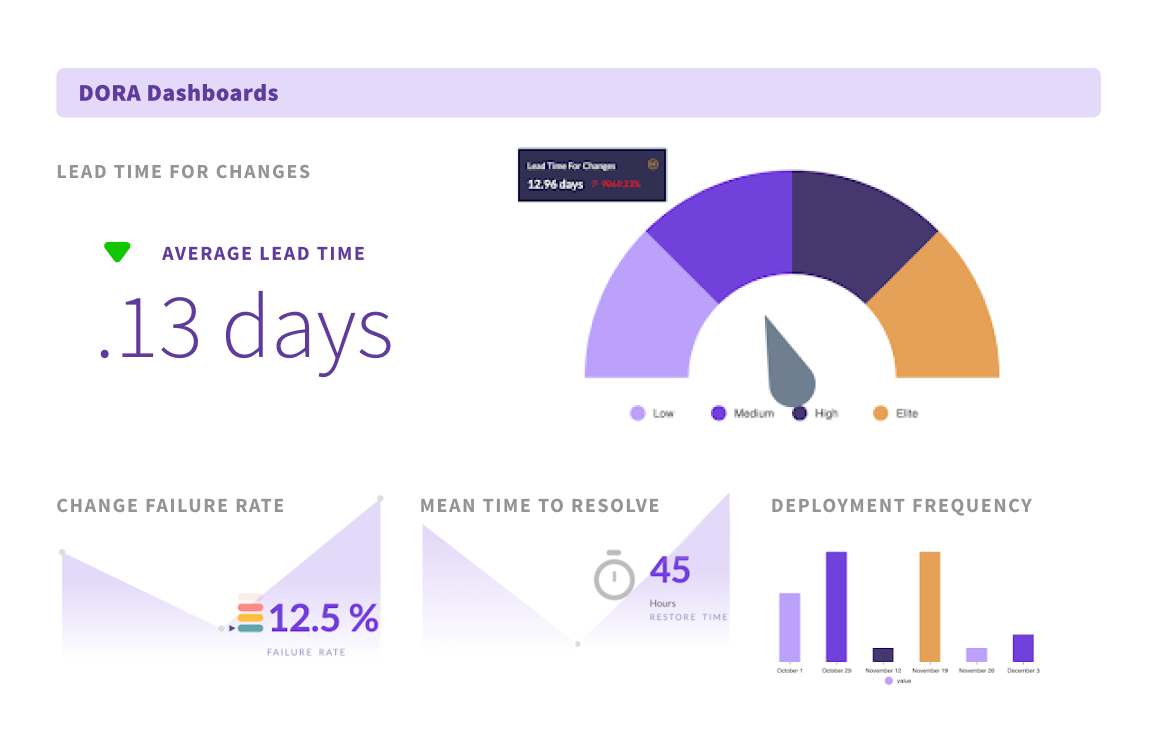
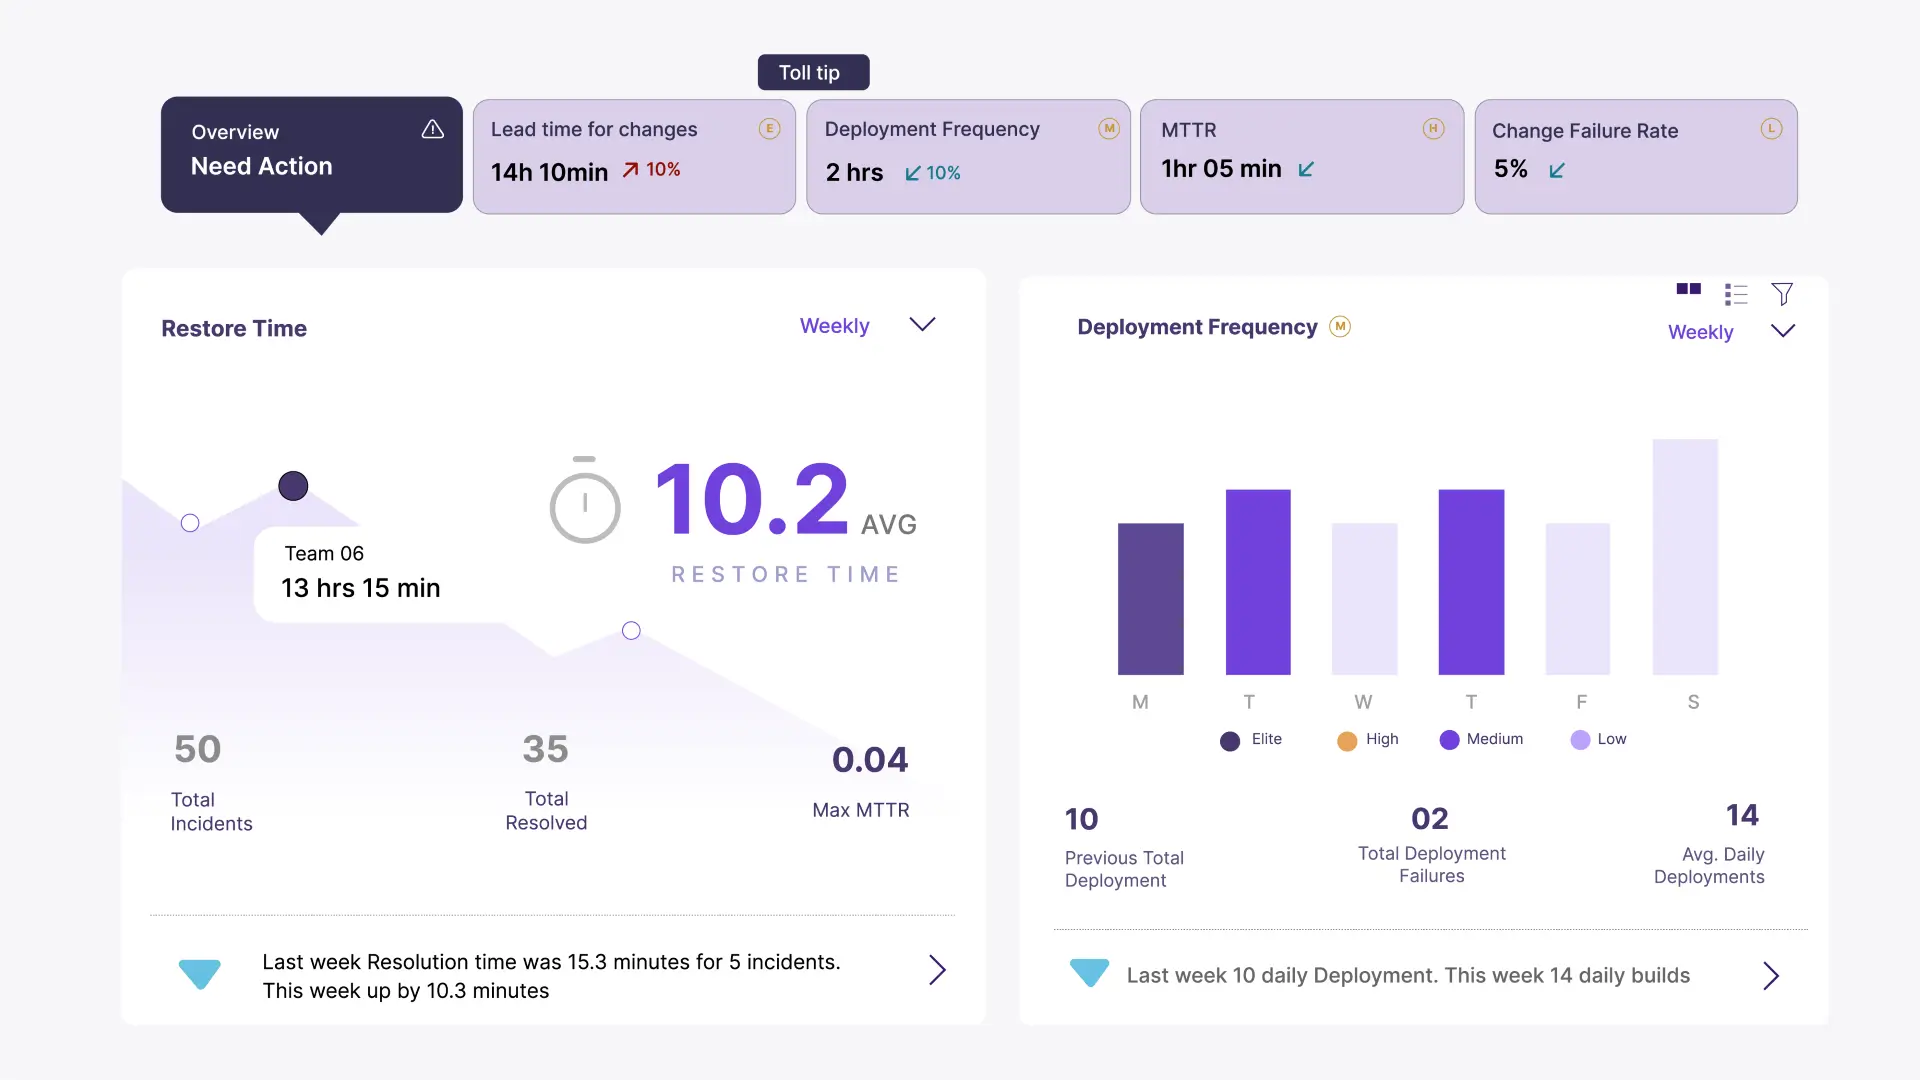
Opsera’s Unified Insights track real-time metrics with DORA. Measuring deployment frequency, lead time, change failure rate, and MTTR across your entire platform. An aid to identify bottlenecks, celebrate wins and optimize for continuous improvement.
Our open API invites endless possibilities. Seamlessly connect your favorite tools and platforms, from security scanners to CI/CD pipelines, and orchestrate your workflow with effortless efficiency.
Ease of use, setup, administration
Opsera Unified Insights consolidates data to easily monitor backups, pinpointing potential issues and simplifying rollback procedures for swift restoration.
One platform, all your apps


Ready to see Opsera in action?
- Easily integrate all your DevOps tools and manage them from one platform.
- Set up and automate CI/CD pipelines in less than 30min.
- Get end-to-end visibility by tracking metrics across teams, tools and projects.
What our community says about us
-

"Our global business diversity and growth adds up to highly distributed engineering teams, complex processes and compliance challenges. Efficient delivery of new features and process standardization is tough. Opsera’s vision for CI/CD enablement and compliance has powerful applications at Uber."
 Ben Booth
Engineering Leader, Uber -

"Opsera’s approach of no code addition of security gates and thresholds into every stage of the pipelines by out of the box integration to a choice of security tools greatly improves the proactive security posture for software delivery. Unified real time security insights is very useful for security managers and adds to the value proposition."
 Abhay Salpekar
Abhay Salpekar, Director of Engineering, Snowflake -

"Opsera DevOps continuous orchestration delivers easy automation of release management across the enterprise applications. Comprehensive visibility from the platform helped us decommission legacy release management tools helping reduce the Opex."
 Dayakar Duwuru
Dayakar Duwuru, Sr. Director of Enterpris applications, NortonLifeLock -

"With this automated solution, the productivity of our engineers improved by 25%. Now, I can see the development and quality metrics of individual contributors."
 Kishore GandhamFounder & CEO, KeyWest Networks
 -

"We had built our own pipelines and tooling over a two year period... the Opsera team built the integration in two days. I feel like the holistic approach that the Opsera is taking to solve the Orchestrating problems is a key step in the evolution of DevOps."
 Kevin RailsbackSenior Director of Technical Operations, Reflektion
 -
"Centralized automation and orchestration across the software delivery lifecycle are crucial to gain the velocity and visibility DevOps teams need to meet business goals. Opsera offers a no-code, intelligent DevOps solution that’s been missing from the marketplace."
 Eric RobertsonIndustry Evangelist, Value Stream Management