





























From AI usage to business impact.
Unified Insights is the software engineering intelligence platform that connects what AI costs, the pace at which work reaches production and what changed along the way. You see where AI is working through three lenses, attribution, throughput and governance, and what to change so more of it does.
LeaderGartner Magic Quadrant for Developer Productivity Insight Platforms, 2026
150+
integrations
250,000+
developers in the Opsera Benchmark
60+
enterprise customers
Every AI-assisted commit that can’t be accounted for is a number that can’t be defended
At enterprise scale, that becomes a budget, an audit and a board question.
One record from commit to production.
AI creates value across the lifecycle. The inner loop records the activity, the outer loop the delivered work, and Unified Insights holds both in one place.
Inner loop
Building the Product
AI-assisted development
CodeBuildCode ReviewTestPlanOuter loop
Shipping the Product
Orchestration and governance
BuildArtifactTestingSecurity & GovernanceCompliance & ApprovalsDeployShared dataset
Every dollar of AI spend, traceable to what it shipped.
AI spend is reported as a total, which is the one form in which it can’t be evaluated. Unified Insights resolves it into unit costs, per pull request, per feature, per tool and model.
The decision it enables
Choose AI investments that lead to value
$850K/month
Recovered from inactive licences before renewal
$1.93M/month
Surfaced across 2,288 developers in 30 days
$142
Calculated per feature delivered
Every AI speed gain, measured all the way to production.
Throughput is set by the slowest stage. Everything spent elsewhere buys utilisation, not delivery. Unified Insights identifies the constraint across teams, repositories and the full path from commit to release.
The decision it enables
Speed up code flow based on metrics
48%
Faster time to PR across the enterprise average
+34%
More features delivered per sprint
4.6×
Longer wait for first review on AI-generated PRs
Every AI-assisted change, with the trail intact.
A change that cannot be traced back is a change that has to be defended by memory. Unified Insights keeps assistant, model and review history attached at commit level,
The decision it enables
Scale AI adoption with evidence and control.
15%
More security vulnerabilities in AI-written code
48 to 84
Range in delivery health across organisations with near-identical adoption
13.5% vs 10.5%
Code duplication, AI-assisted against manual
Inside Unified Insights.
AI investment & tokenomics
Understand modelled engineering capacity and usage across tools, models, seats and teams — and connect investment decisions to engineering outcomes.
- Spend and token usage by tool, model, seat and team
- Cross-assistant comparison and normalisation
- Idle and underutilised licence visibility
- Performance against your own baseline
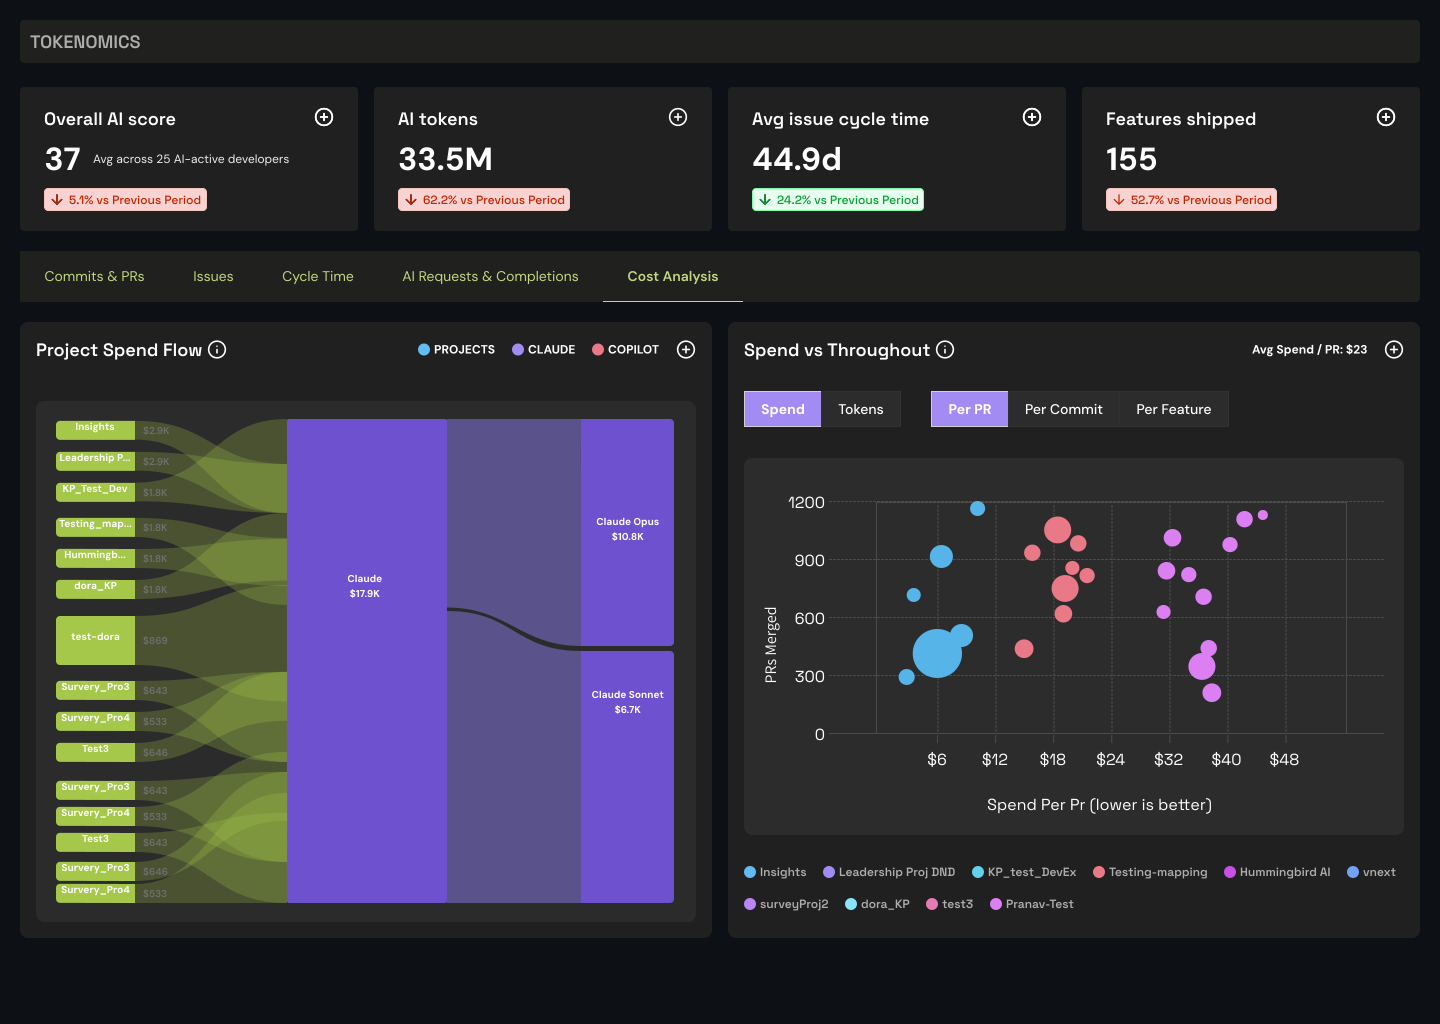
Tokenomics overview — overall AI score, tokens, cycle time, features shipped. Developer Velocity Index
Understand how AI adoption is changing developer activity, engineering capacity and productivity across your organisation.
- AI adoption and utilisation trends
- Developer productivity and capacity signals
- Team, repository, language and tool views
- Benchmark context and your own baseline
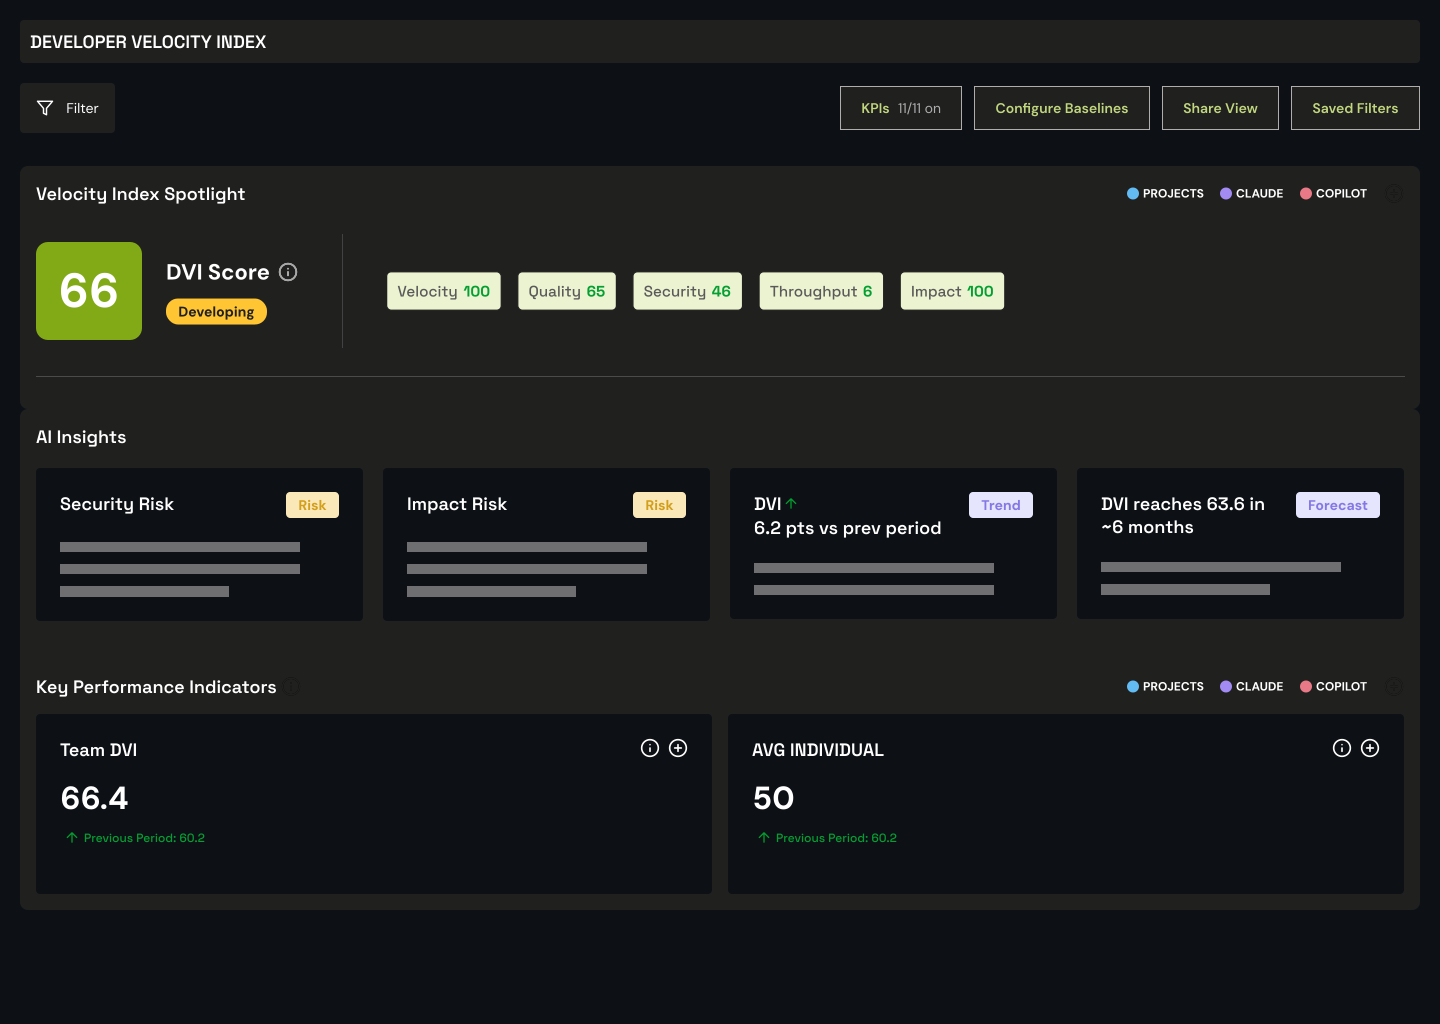
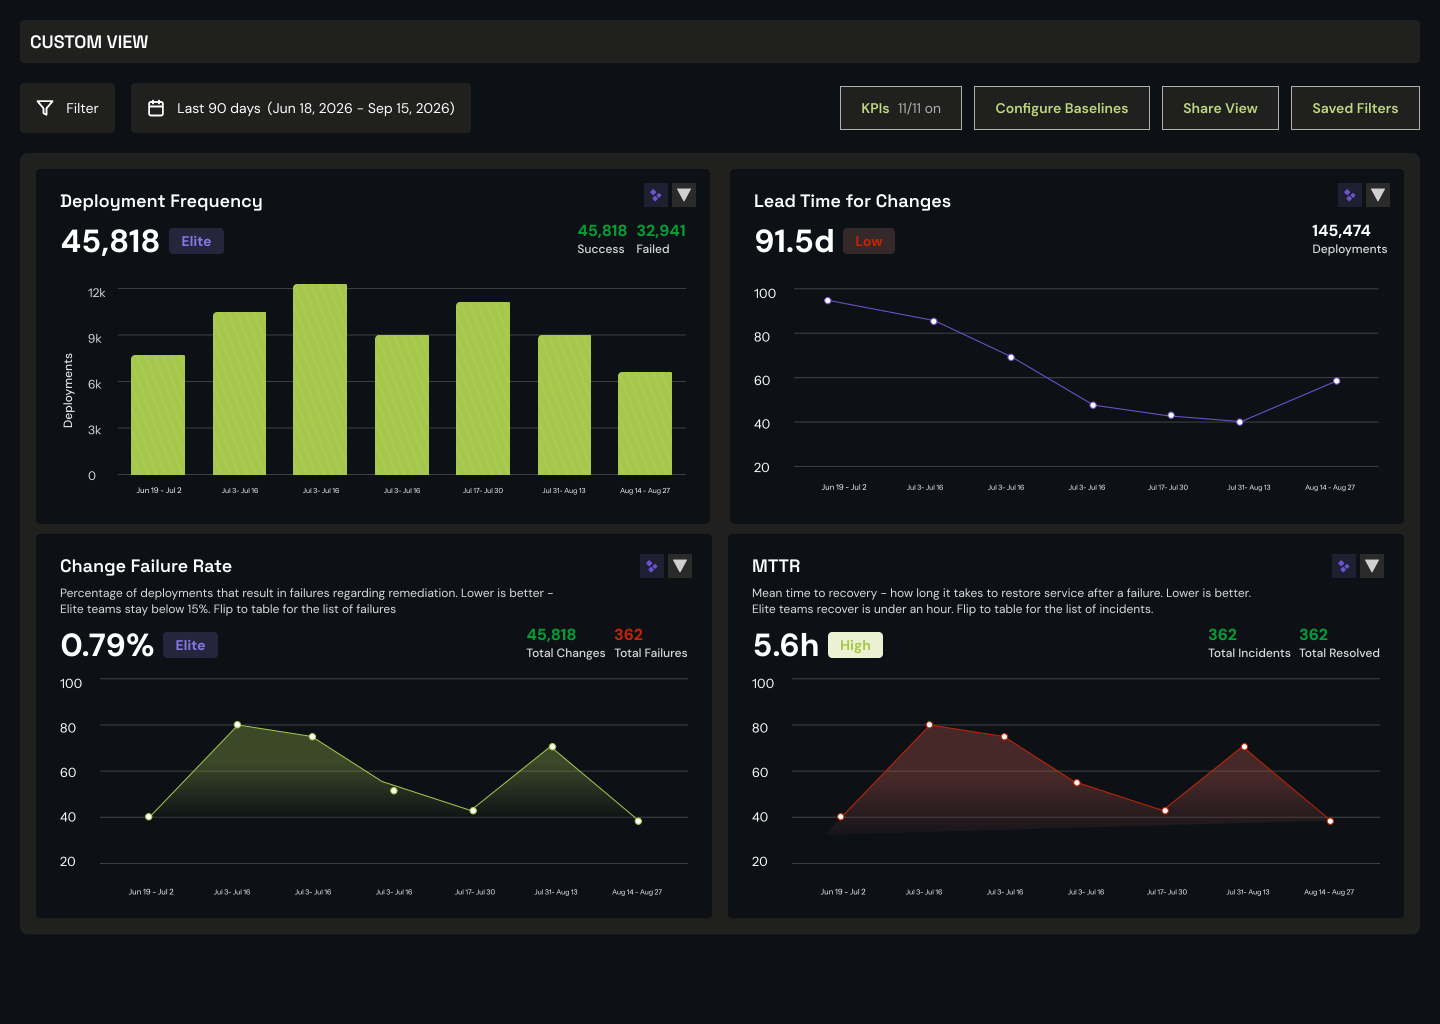
Developer Velocity Index — DVI score with velocity, quality, security, throughput and impact dimensions. DORA & flow metrics
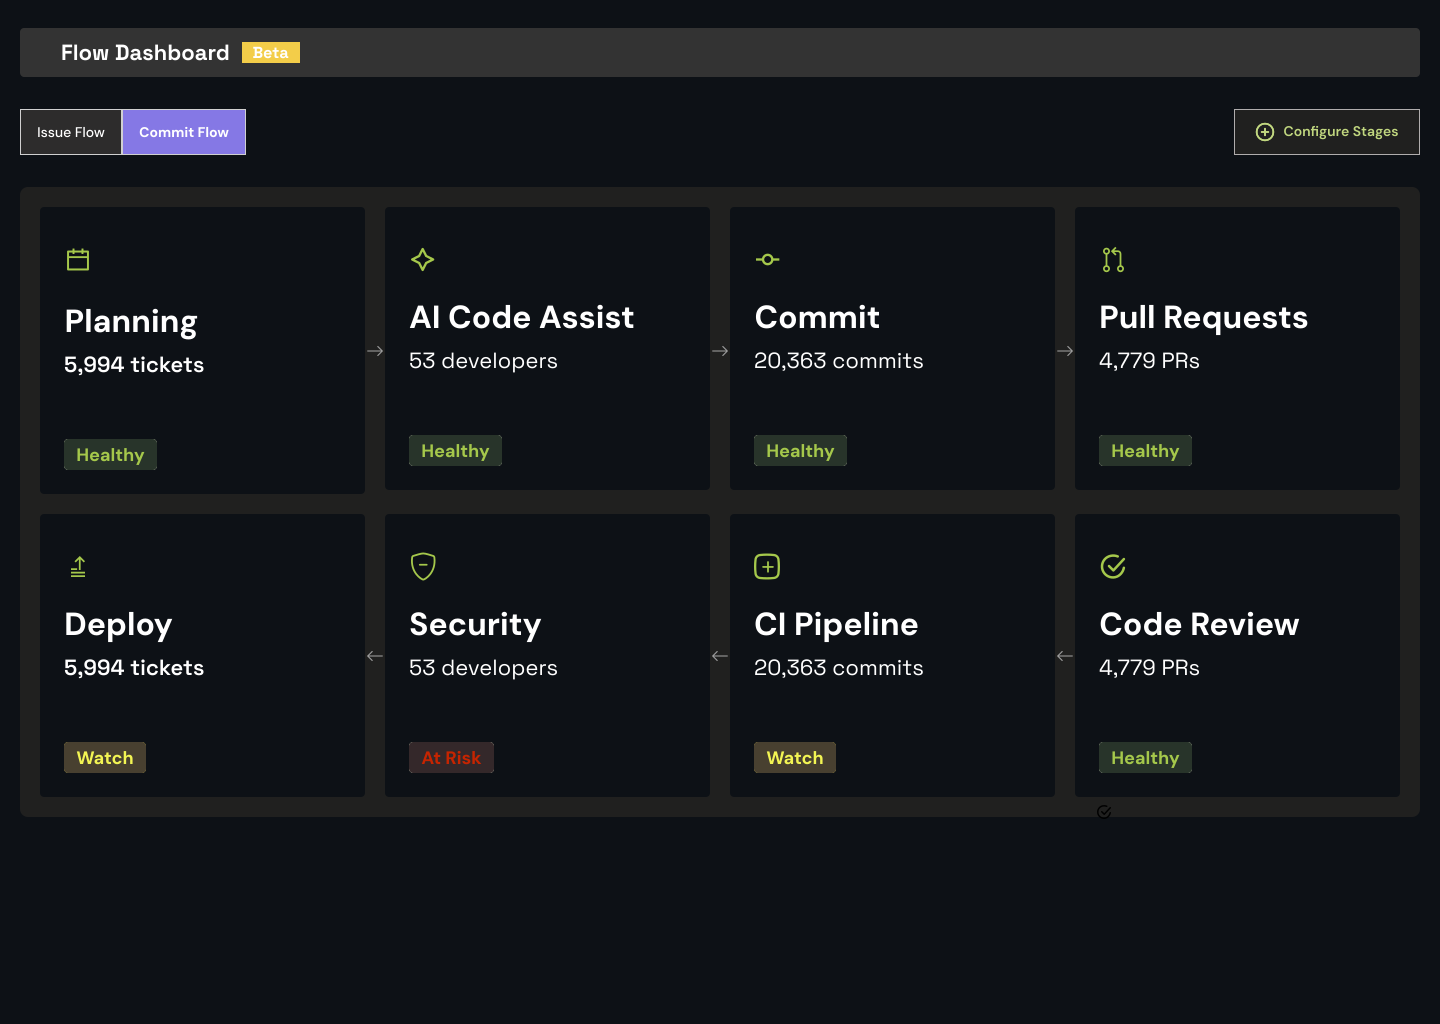
Follow work through the delivery system to understand how engineering gains translate into flow and delivery performance.
- DORA and delivery performance metrics
- Cycle time, time-to-PR and review flow
- Deployment and workflow signals
- Constraints by team, repository, stage and language
Persona insights
Give each leader a role-scoped view of the same connected engineering data — so they can investigate the questions and signals most relevant to their responsibilities.
- CTO and CISO: “Which AI-written code went in without review?” — provenance, review coverage, vulnerability patterns and audit evidence
- CFO and Finance: “Did we get back more than the licences cost?” — AI spend, utilisation, licence opportunity and modelled capacity
- Engineering leaders: “Why did cycle time move last sprint?” — DORA, SPACE, DevEx, cycle time and delivery context
- VP Engineering: delivery performance, AI adoption, capacity and outcomes
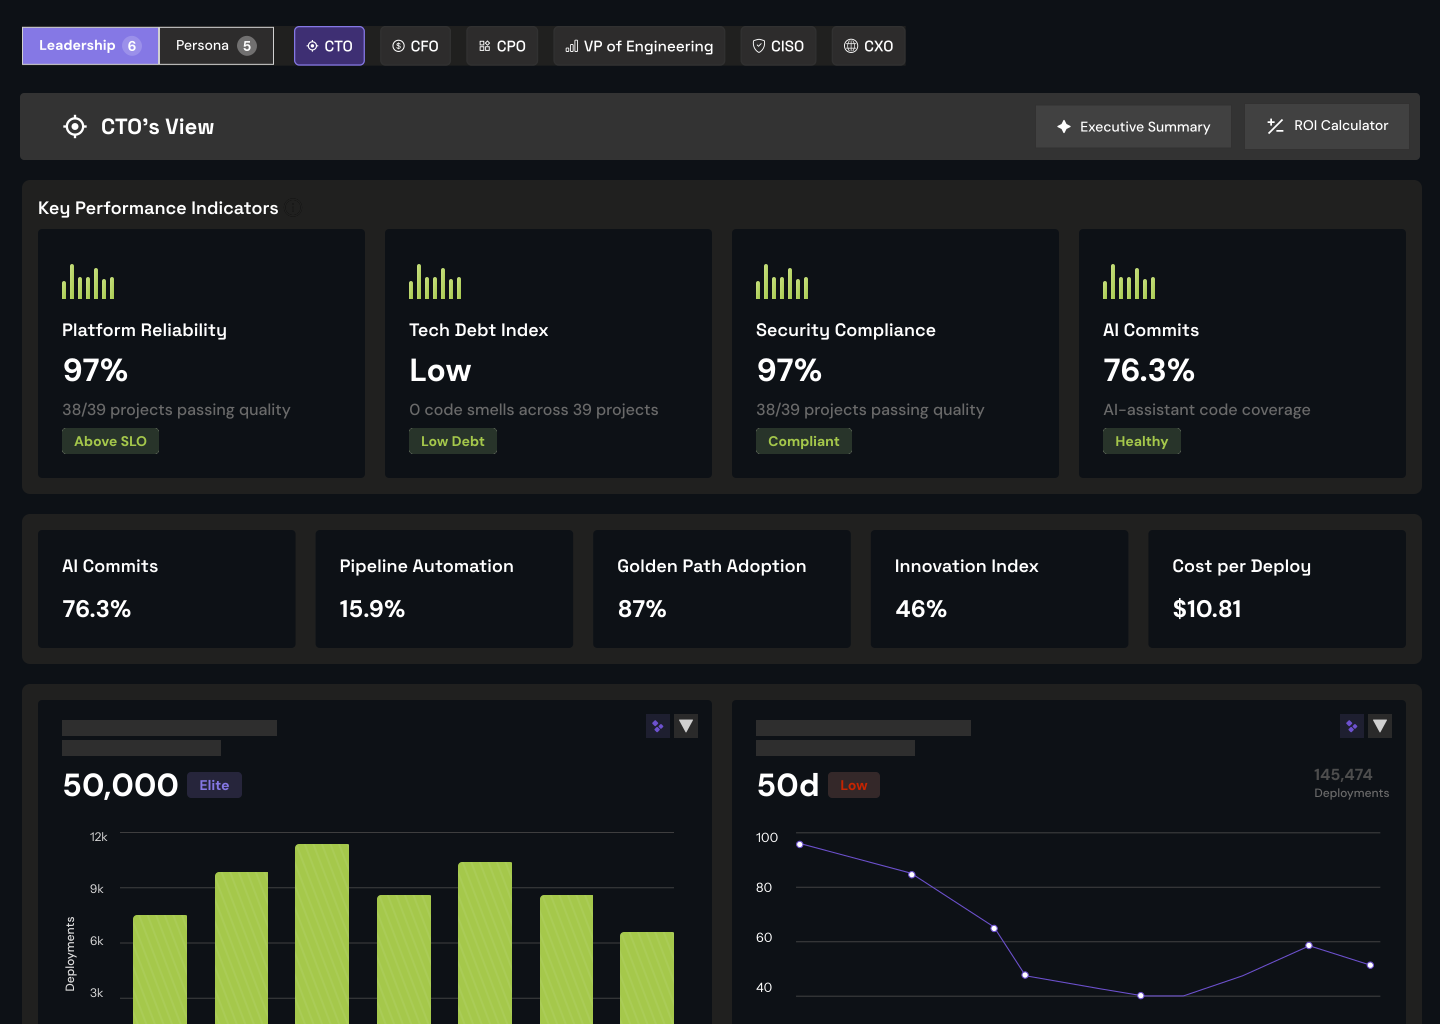
Persona dashboard — CTO, CFO, CPO, VP Engineering, CISO and CxO views over the same record. Coding assistant intelligence
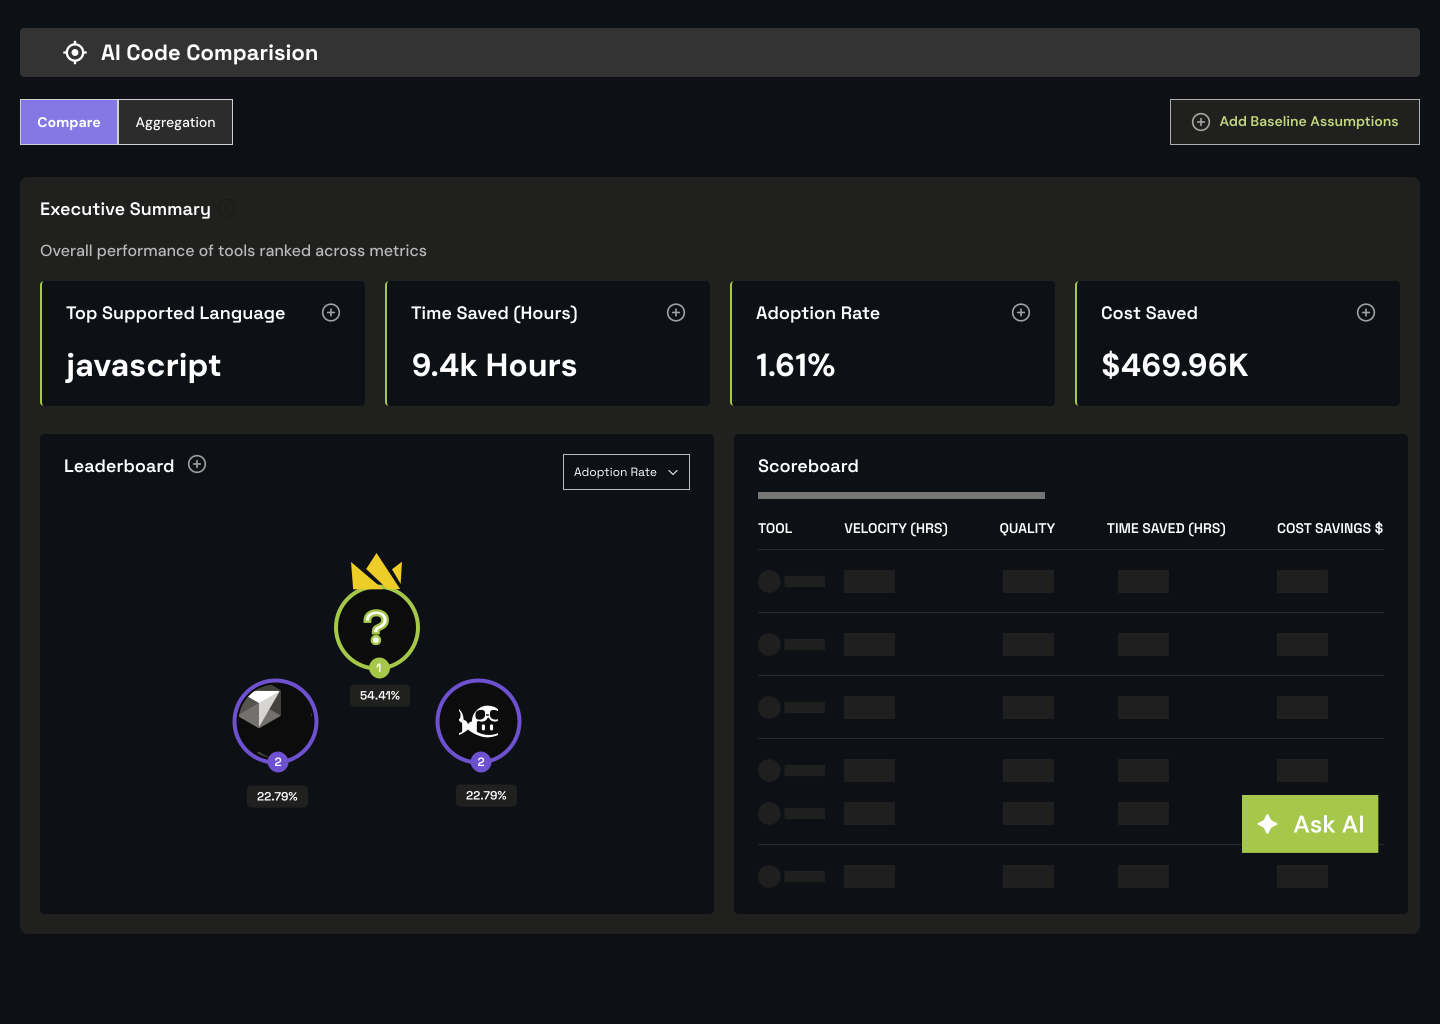
Create a trustworthy account of AI-assisted engineering with evidence about contribution, review, quality and security.
- Commit-level AI code provenance
- Review coverage for AI-assisted changes
- Vulnerability patterns by tool, team and language
- Role-scoped audit evidence
Ask HummingBird AI.
Anyone who can ask the question can get the answer — no query language, no data team in between.
- Ask“We’re at $412K in tokens this month. What shipped?”
- Ask“AI-assisted PRs are 3× larger. Is that what’s holding review?”
- Ask“We’re at 42% AI-assisted commits. Where does that concentrate, and does review keep pace?”
Start with the tools you already use.
Connect your AI assistants, source code, planning, delivery and security tools through 150+ integrations.
Read from the tools you already use
Three connections: source code, planning tools, and your coding assistants. No new instrumentation beyond what those systems already emit.
Cloud agnostic
Can be deployed in any cloud environment, including AWS, GCP and Azure.
On-prem or SaaS
Role-scoped views and full on-premises deployment when data can’t leave the environment.
Customer evidence.
Honeywell
$1.93M/month
identified across 2,288 developers within 30 days of connecting
700
inactive licences surfaced ahead of renewal

LTM
23%
increase in pull request velocity, measured by Opsera Unified Insights
20%
growth in commit volume after enterprise-wide Copilot rollout

Questions buyers ask, answered straight.
What are DORA metrics?
DORA metrics are four measures of software delivery performance: deployment frequency, lead time for changes, change failure rate and time to restore service. Together they show how quickly a team ships and how safely. They measure the delivery system, not individual developers.
How do you measure developer productivity?
Measure the system, not the person. DORA covers delivery performance, SPACE covers satisfaction and collaboration, DevEx covers friction in daily work. Used together they show where work slows down. Any single metric - lines of code, commits, story points - is gameable and tells you nothing useful.
How do you track developer productivity?
Connect the tools your team already uses - source control, CI/CD, ticketing, AI assistants - and read the signals they already emit. No new instrumentation and no self-reporting. Track at team, repository and tool level so you are looking at the delivery system rather than ranking people.
What is developer productivity?
Developer productivity is how effectively an engineering organisation turns effort into shipped, working software. It is not output volume. A team writing less code that reaches production faster and breaks less often is more productive than one writing more.
How do you measure AI ROI?
Connect what AI costs to what it delivered. That means spend per tool, model, seat and team on one side, and delivery outcomes on the other - features shipped, cycle time, defect rate. Reported as a total, AI spend is the one form in which it cannot be evaluated.
How do you evaluate ROI on enterprise AI investments?
Start with utilisation: how many licences are actually being used. Then look at whether adoption is changing throughput, and whether that throughput is reaching production. Finally check quality and security did not degrade. ROI claimed at any earlier stage is usually measuring activity, not value.
What tools measure the ROI of AI initiatives?
Lorem ipsum dolor sit amet, consectetur adipiscing elit, sed do eiusmod tempor incididunt ut labore et dolore magna aliqua. Ut enim ad minim veniam, quis nostrud exercitation ullamco laboris nisi ut aliquip ex ea commodo consequat.
Answer needed
How long before we see something useful?
Lorem ipsum dolor sit amet, consectetur adipiscing elit, sed do eiusmod tempor incididunt ut labore et dolore magna aliqua. Ut enim ad minim veniam, quis nostrud exercitation ullamco laboris nisi ut aliquip ex ea commodo consequat.
Answer needed
Is this developer surveillance?
No. Measurement sits at team, repository, tool and model level, not individual performance ranking. Persona dashboards give each leader the view their role needs without exposing individual scorecards.
Can we run Unified Insights on-premises?
Yes. Insights in a Box gives full platform capability on-premises, so developer data never leaves your environment. It is the complete product, not a reduced version.
What is Hummingbird AI?
Hummingbird AI is natural language querying over your engineering data. Anyone who can ask the question gets the answer - no query language, no data team in between.
Get insights for your AI SDLC.
Connect your toolchain and read the first attributed numbers against your own baseline.