
Software Engineering Intelligence Hub.
How to measure software delivery, one metric and one comparison at a time.
- AI Code Assistant AnalyticsMeasure the impact of AI coding tools on engineering productivity and outcomes. This category helps organizations go beyond adoption metrics to understand code quality, developer efficiency, and real business value.6 articles
- CI/CD & Platform AnalyticsHow DevOps teams can understand pipeline performance, platform usability, and the infrastructure readiness behind modern software delivery.2 articles
- Delivery Flow & PerformanceMeasure how efficiently software moves from idea to production. This category covers delivery speed, throughput, predictability, and overall value flow across the software development lifecycle.8 articles
- Developer ExperienceEvaluate how the engineering environment influences productivity and team effectiveness. This category highlights workflow friction, developer satisfaction, and the conditions that support sustainable performance.3 articles
- Quality & RiskTrack the signals that reflect software quality, stability, and security. This category helps teams monitor defects, failures, vulnerabilities, and the broader risks that impact delivery confidence.5 articles
- Reliability & IncidentsUnderstand how well systems maintain availability and recover from disruption. This category focuses on detection, response, restoration, and incident trends that shape operational resilience.4 articles
Every article.
Showing 9 of 28 articles, page 1 of 4.
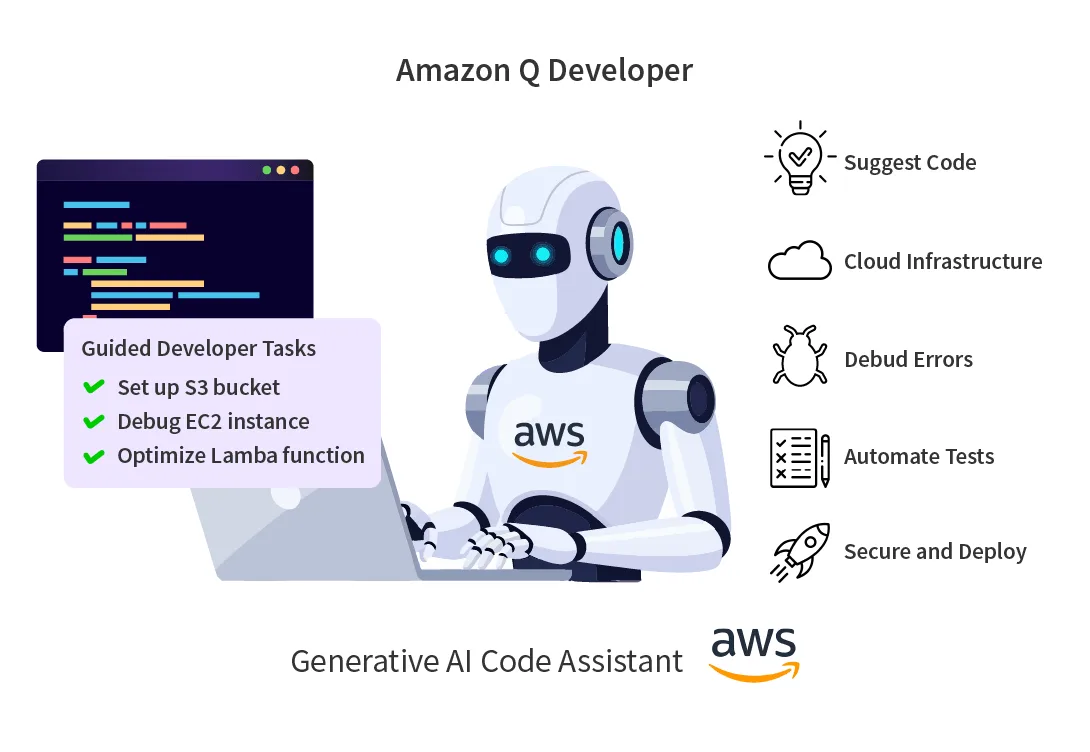
Amazon Q Developer
Amazon Q Developer is a generative AI-powered code assistant embedded into developer workflows to support cloud-native and AWS-centric software delivery. Evolving from Amazon CodeWhisperer, it goes beyond code generation and suggestions by helping teams design, build, test, deploy, troubleshoot…
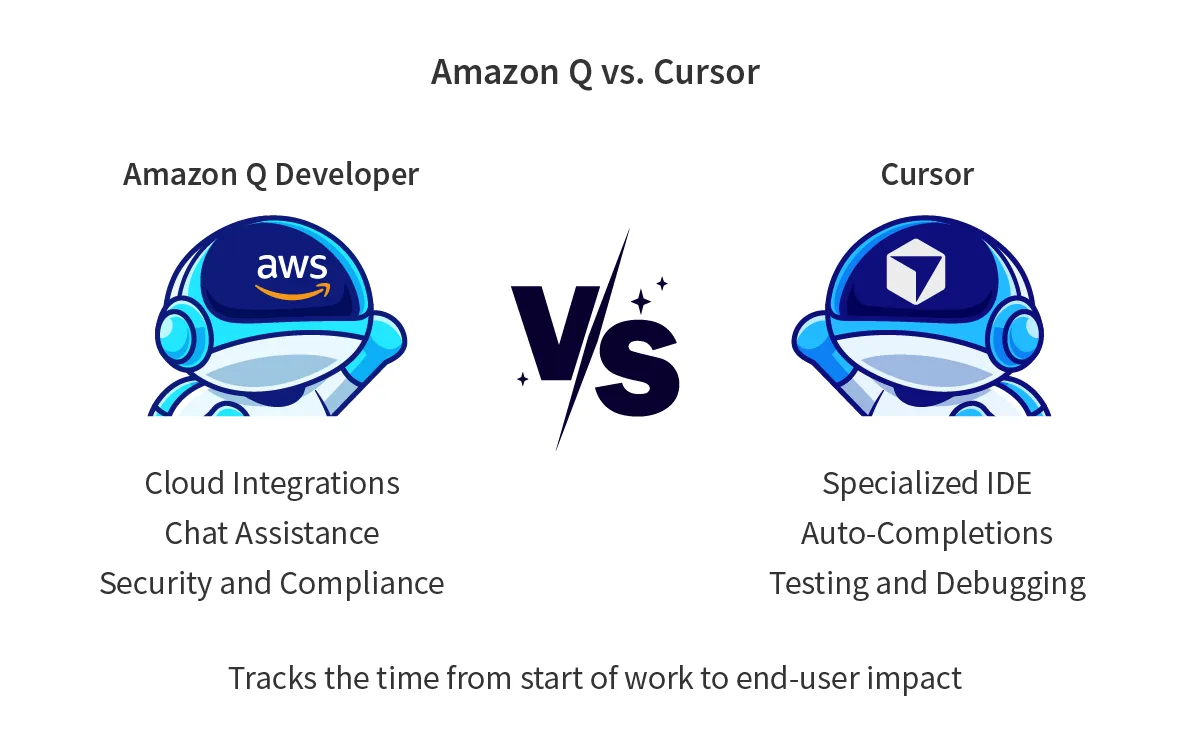
Amazon Q vs Cursor
Two AI Coding Tools, Two Completely Different Philosophies
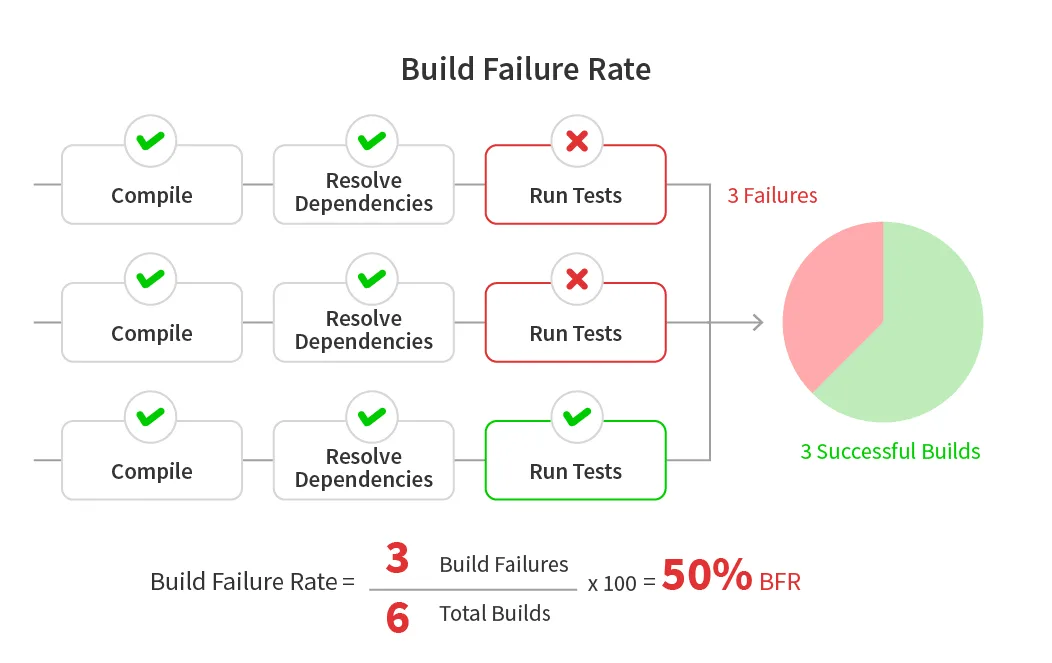
Build Failure Rate: What it Tells Engineering Teams
Build Failure Rate (BFR) is a software engineering metric that quantifies the proportion of build executions in a Continuous Integration (CI) pipeline that fail over a given time period, relative to the total number of build attempts. This metric helps teams identify areas of high failure and then…
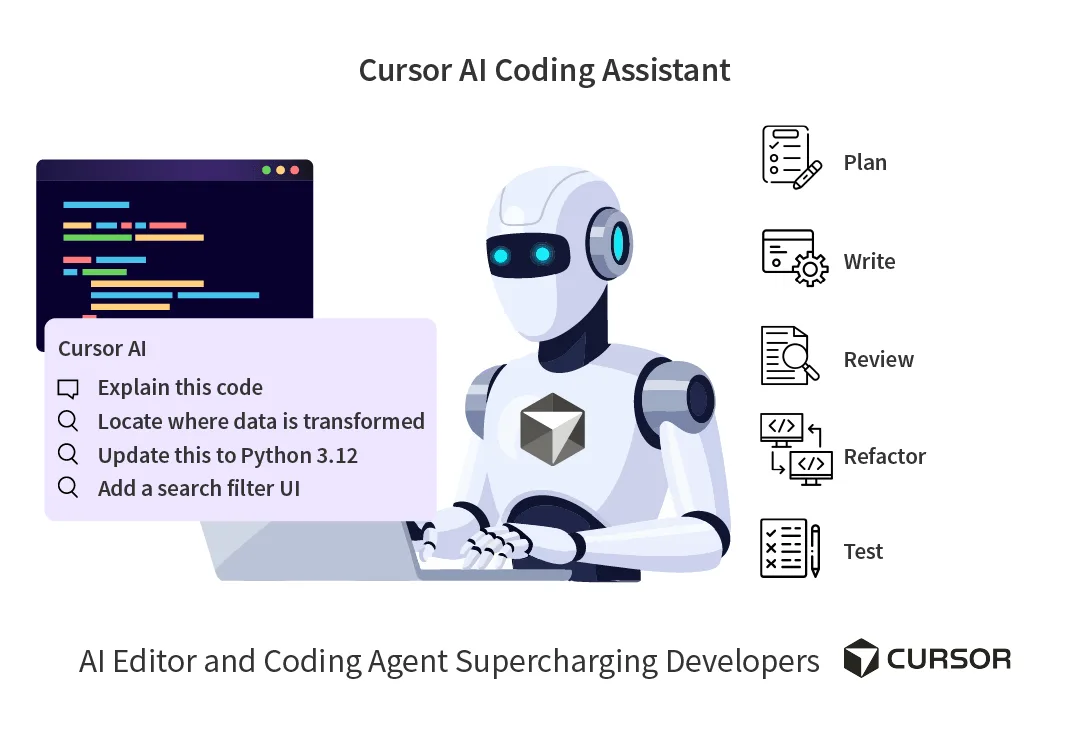
Cursor AI Explained
How the AI-Native Code Editor Is Changing Software Development
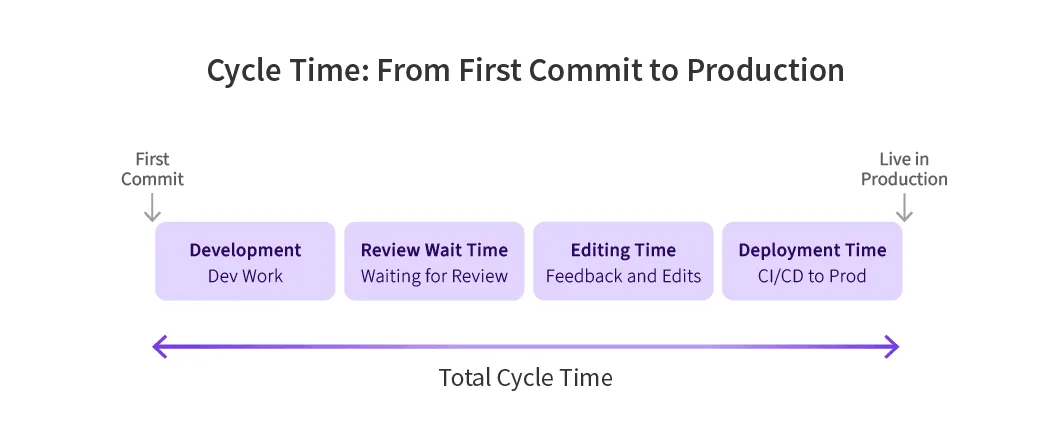
Cycle Time Mastery: From First Commit to Production
Cycle Time measures the total elapsed time from a developer's first commit on a feature branch to the moment that code successfully deploys and runs in production.
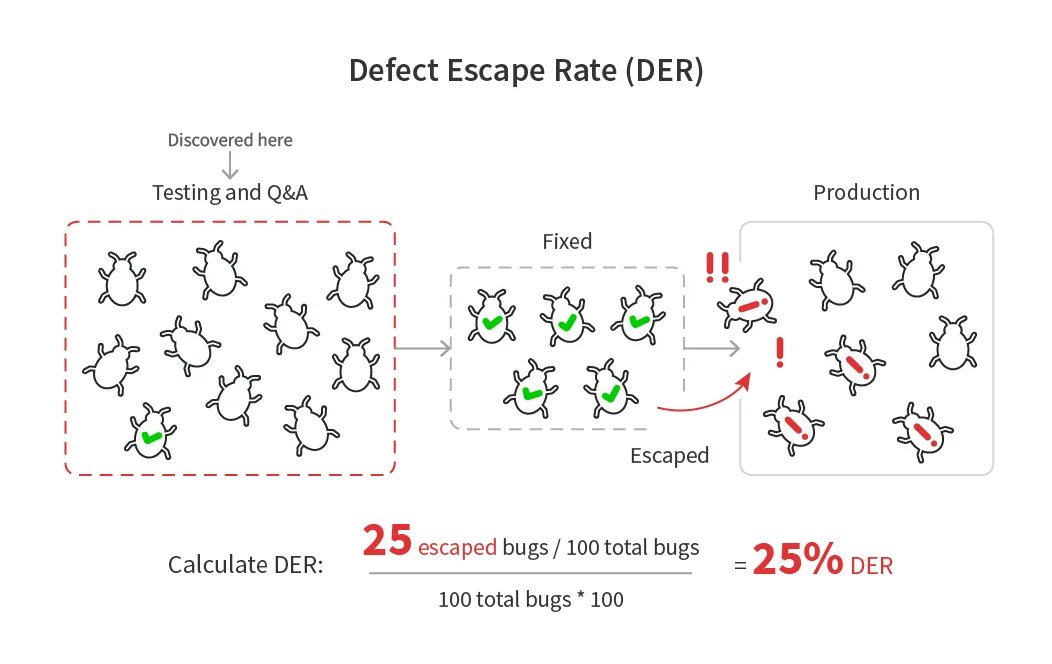
Defect Escape Rate (DER): A Comprehensive Guide
Defect escape rate (DER) is the percentage of bugs or issues that are discovered in production after a release, compared with the total number of defects found across the software delivery lifecycle. It measures how many defects “escaped” pre-release detection and reached end users. Therefore, DER…
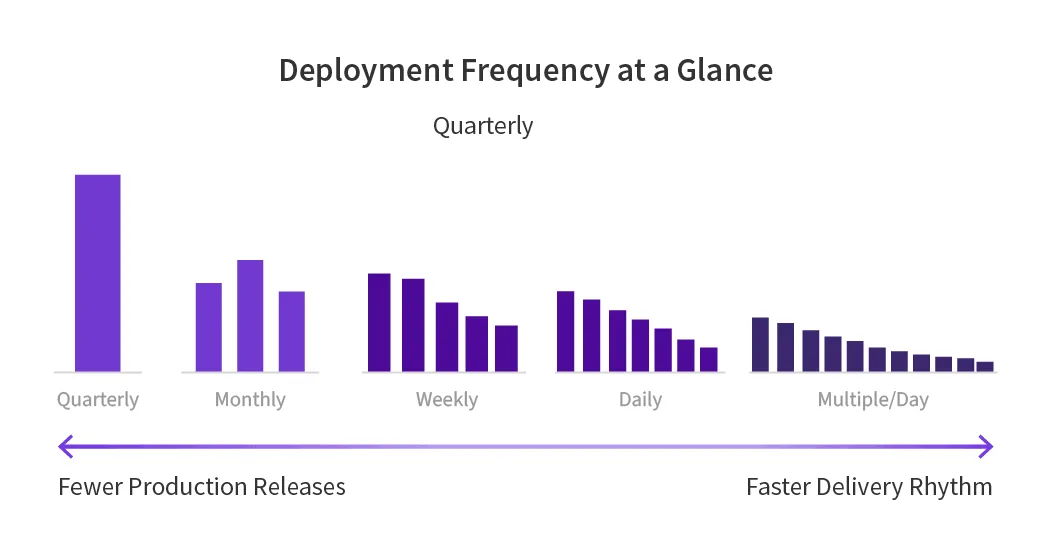
Deployment Frequency: A Clear Window Into Your Software Delivery Engine
Deployment frequency measures how often an organization successfully releases code to production. Teams count each time software moves from development into the hands of users, whether that happens multiple times per day or once per quarter. This metric captures the rhythm of software delivery and…
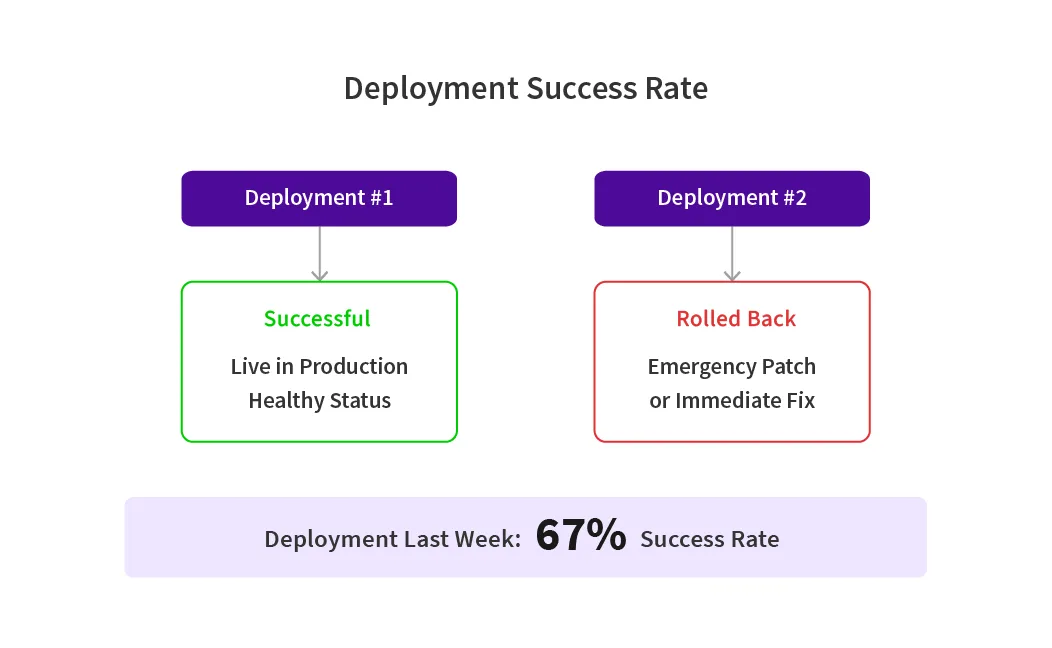
Deployment Success Rate
Deployment success rate measures how often a new release or change makes it to production without a hitch.
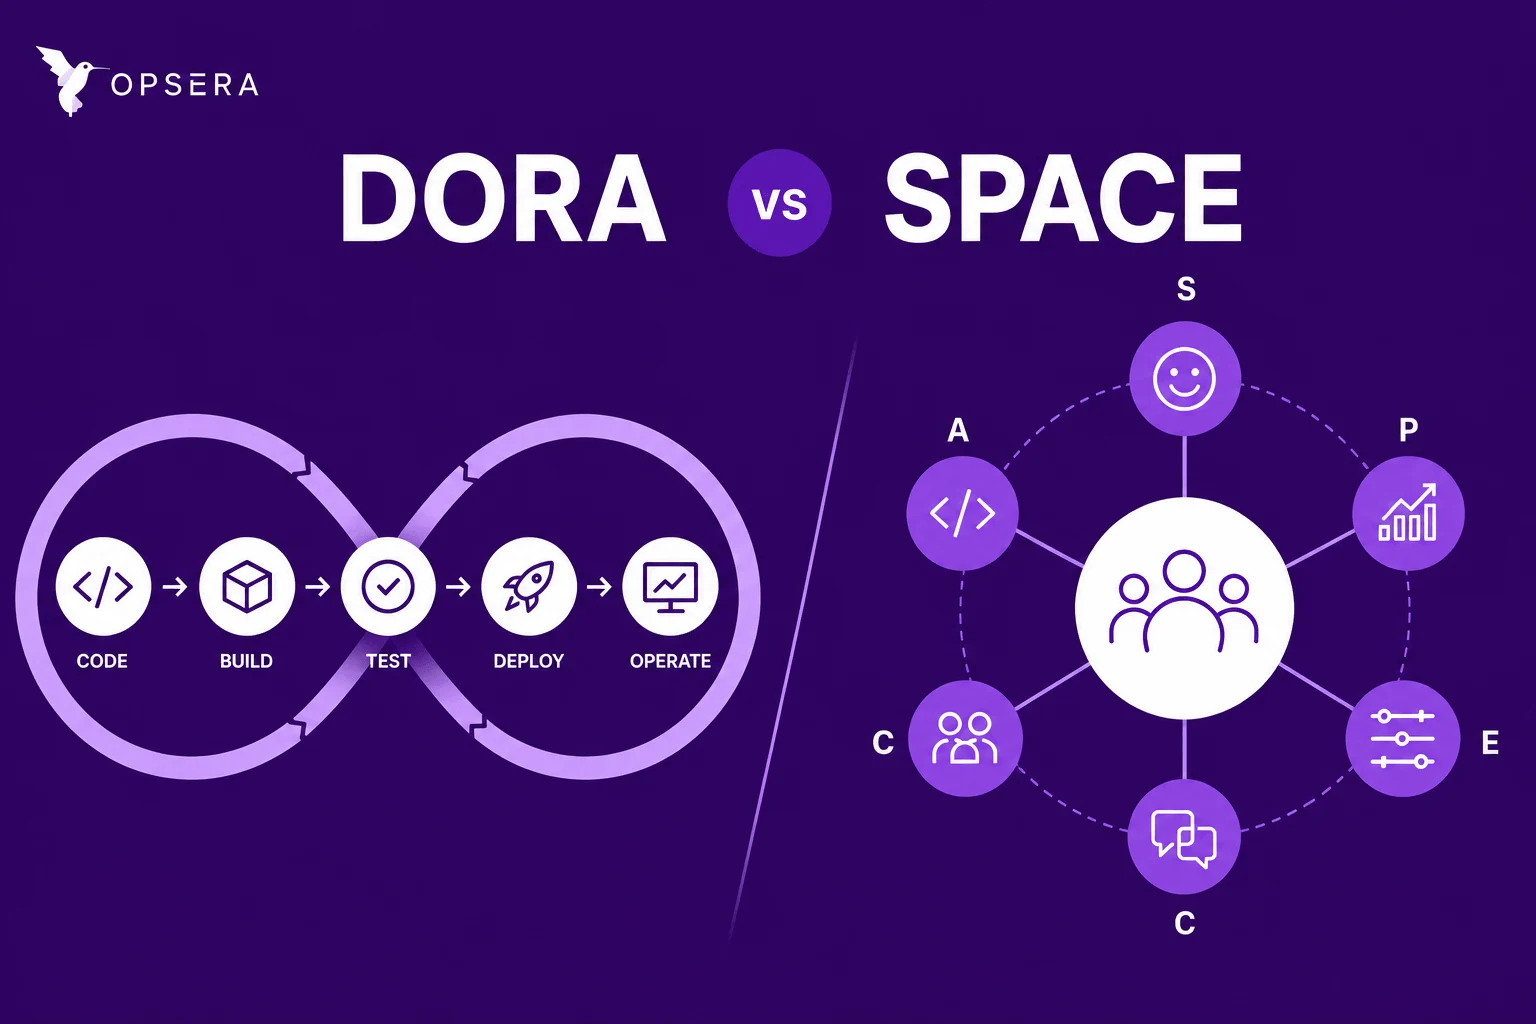
DORA vs SPACE Metrics: Key Differences, Use Cases, and When to Use Each Framework
For many years, organizations relied on activity-based metrics to evaluate engineering performance. Common examples included lines of code written, number of commits, story points completed, and tickets resolved. While these metrics can provide visibility into engineering activity, they rarely…
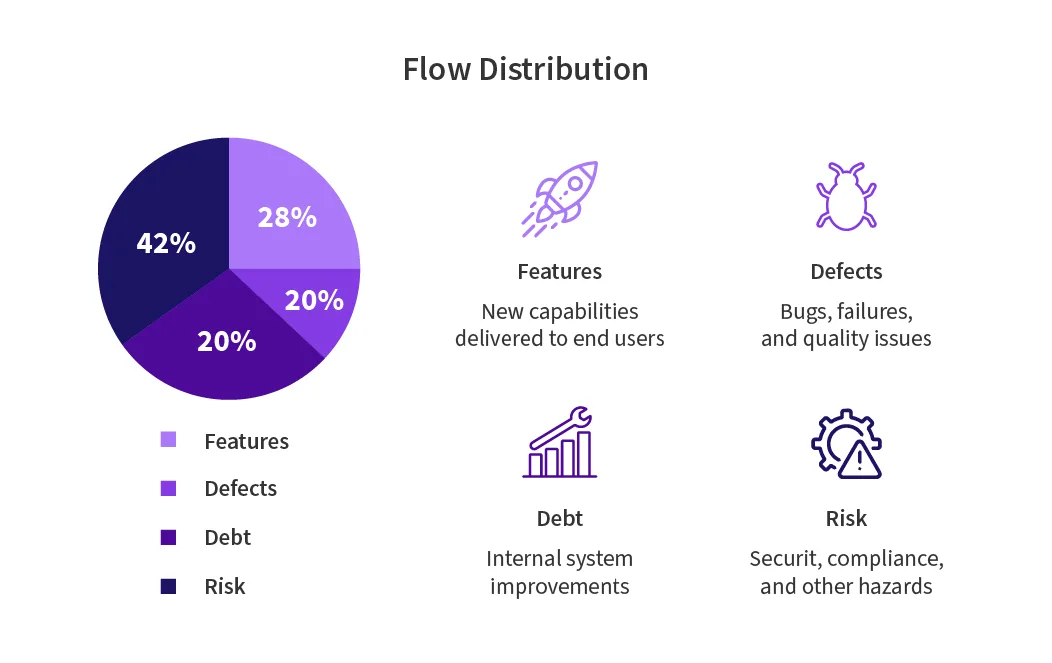
Flow Distribution
Flow distribution shows how work is allocated across different categories of software engineering activity.
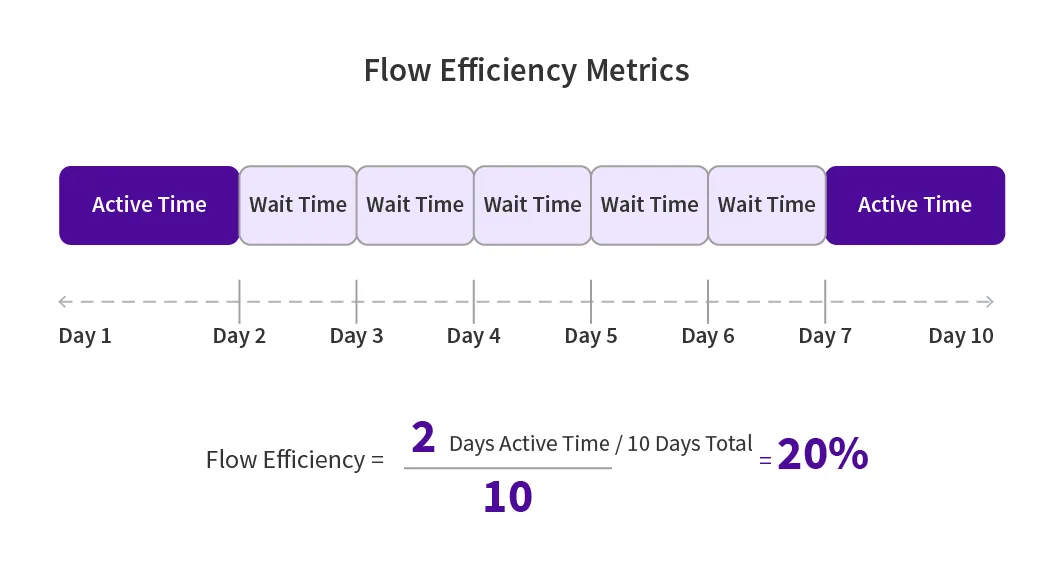
Flow Efficiency Metrics
Where Your Engineering Time Actually Goes
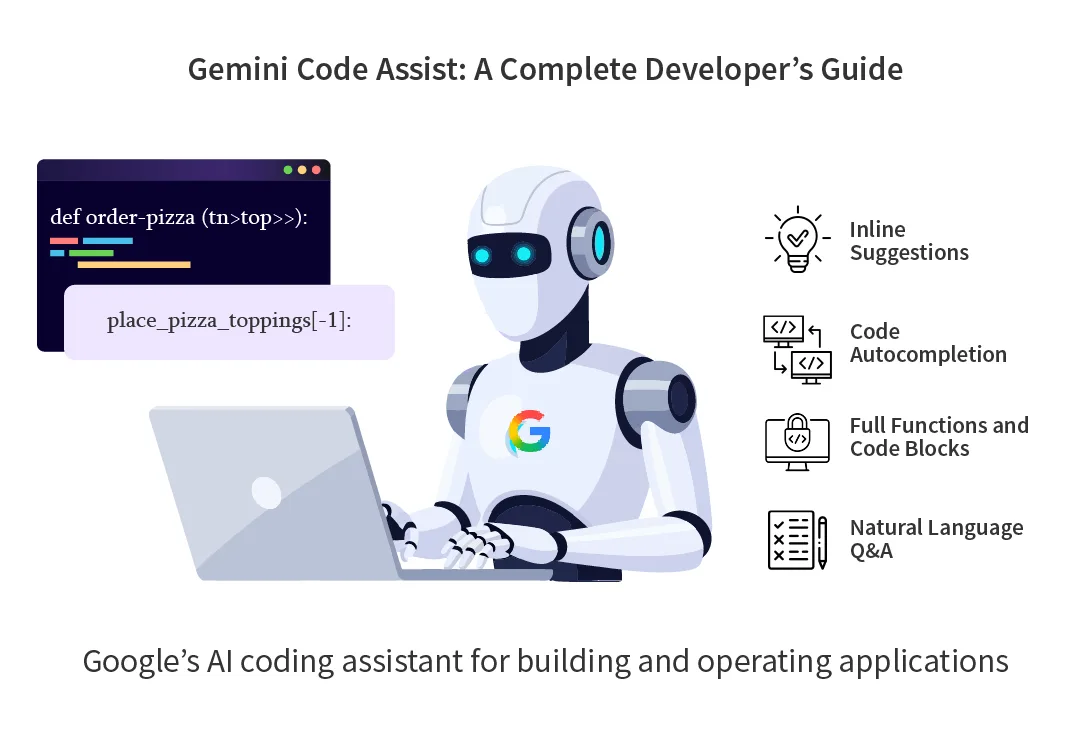
Gemini Code Assist: A Complete Developer’s Guide
Gemini Code Assist is an AI-powered coding assistant developed by Google to help developers build, deploy, and operate applications throughout the software development lifecycle. Tapping the potential of Gemini 2.5 large language model, it integrates directly with development environments such as…
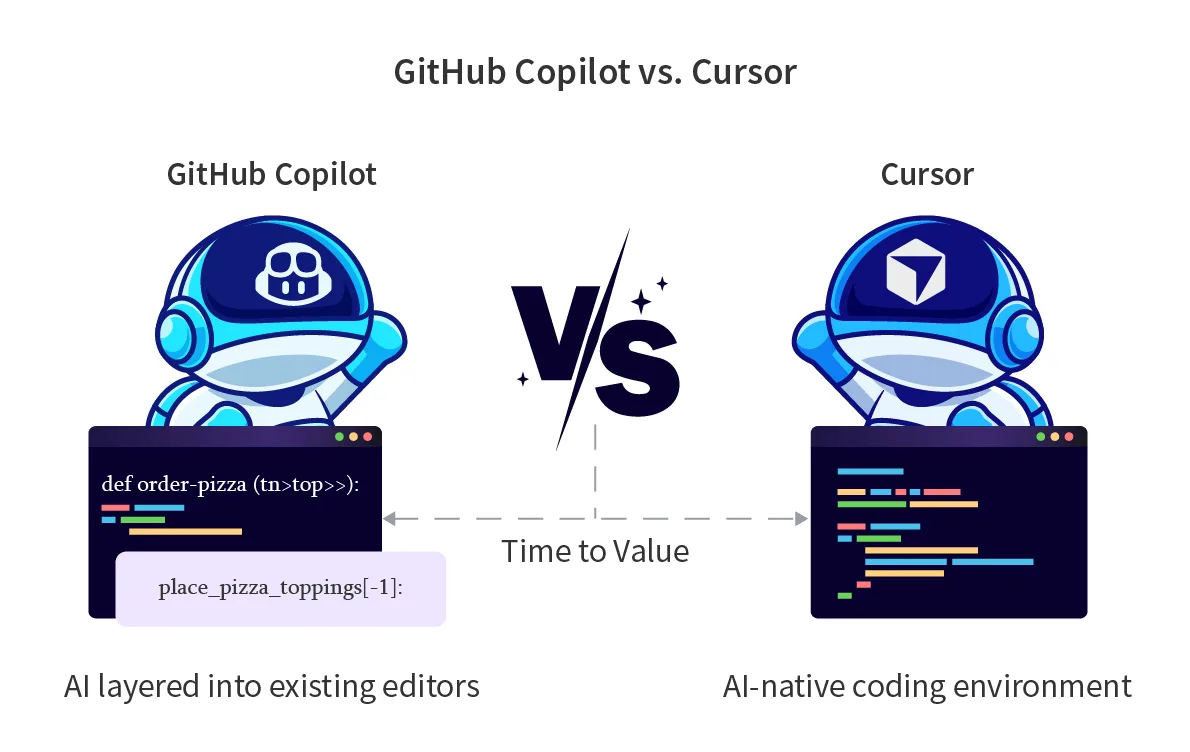
GitHub Copilot vs Cursor
GitHub Copilot and Cursor represent two distinct theories of how AI assistance should fit into a developer's workflow. Copilot is built around augmenting the editor a developer already uses, layering AI capabilities into existing environments without requiring a context switch. Cursor is built…
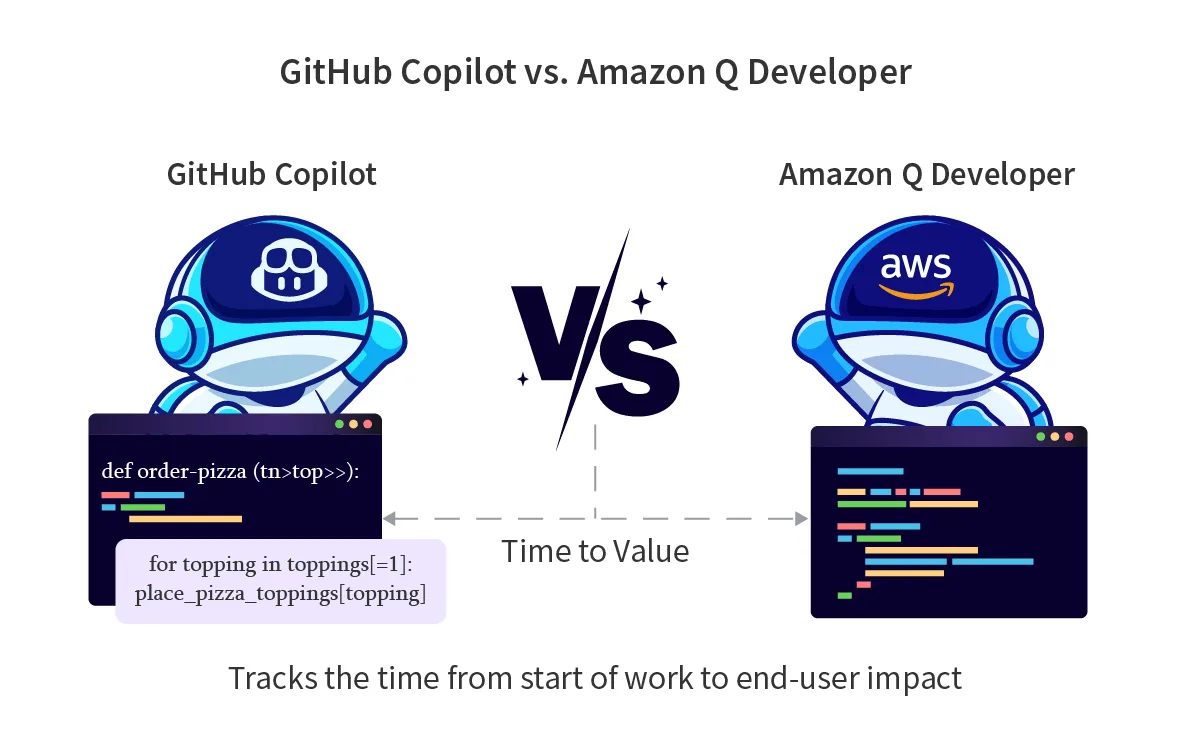
GitHub Copilot vs. Amazon Q Developer
GitHub Copilot and Amazon Q Developer are two of the most widely deployed AI coding assistants available to engineering teams. Both offer inline code completions, chat-based assistance, and IDE integrations. Both have free tiers, agentic capabilities, and enterprise pricing. On the surface they…
Incident Frequency
How often your systems break, why that number lies to you, and what to do about it.
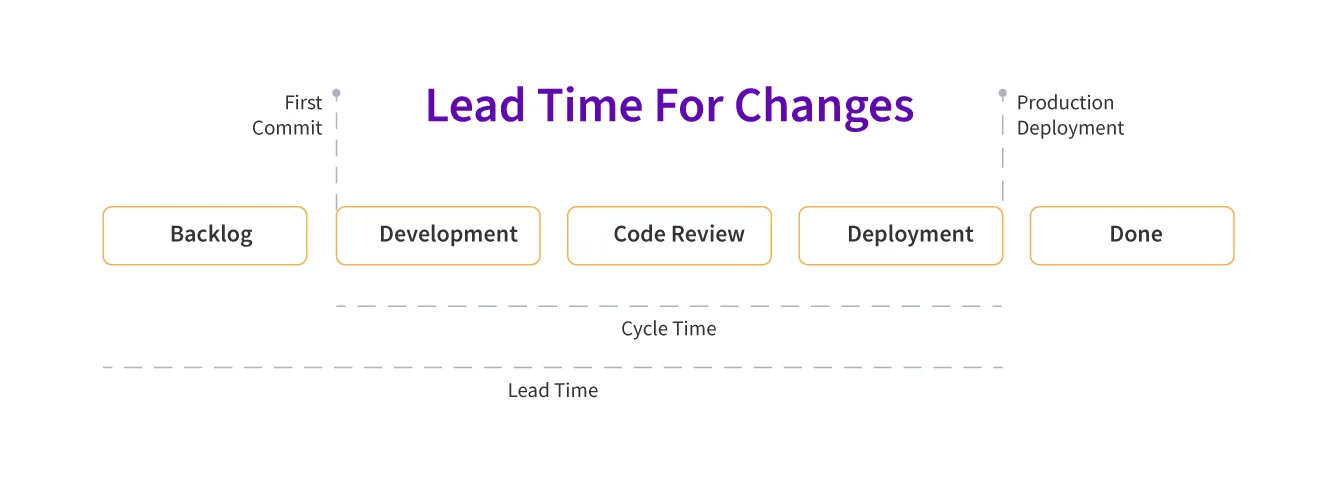
Lead Time for Changes and Mean Lead Time
Lead time for changes measures the duration from code commit to production deployment. Every time a developer pushes code to your repository, the clock starts. It stops when that exact code runs in production, serving real users. This metric captures your engineering organization's fundamental…
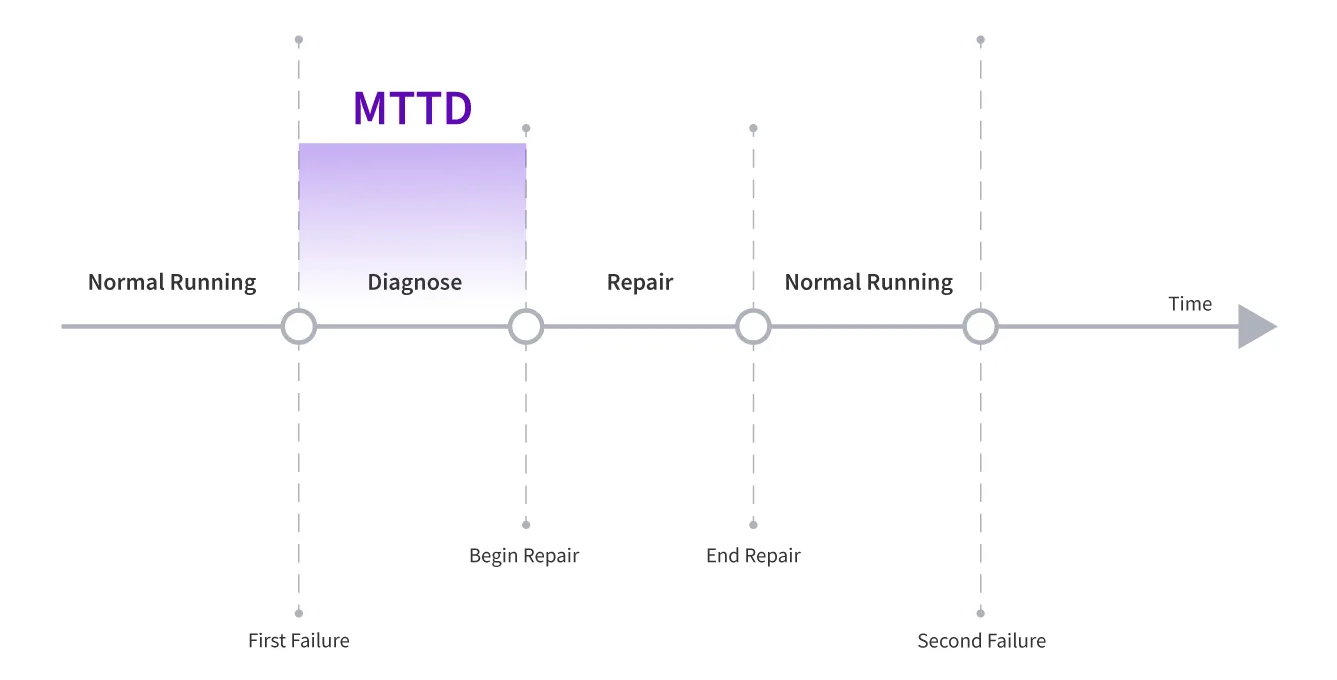
Mean Time to Detect (MTTD): What It Is, Why It Matters, and How Teams Use It
Most incidents don’t start with a loud failure. They begin quietly: an error rate creeping up, a service slowing down, a subtle signal that’s easy to miss. By the time the problem is obvious, the impact is already underway.
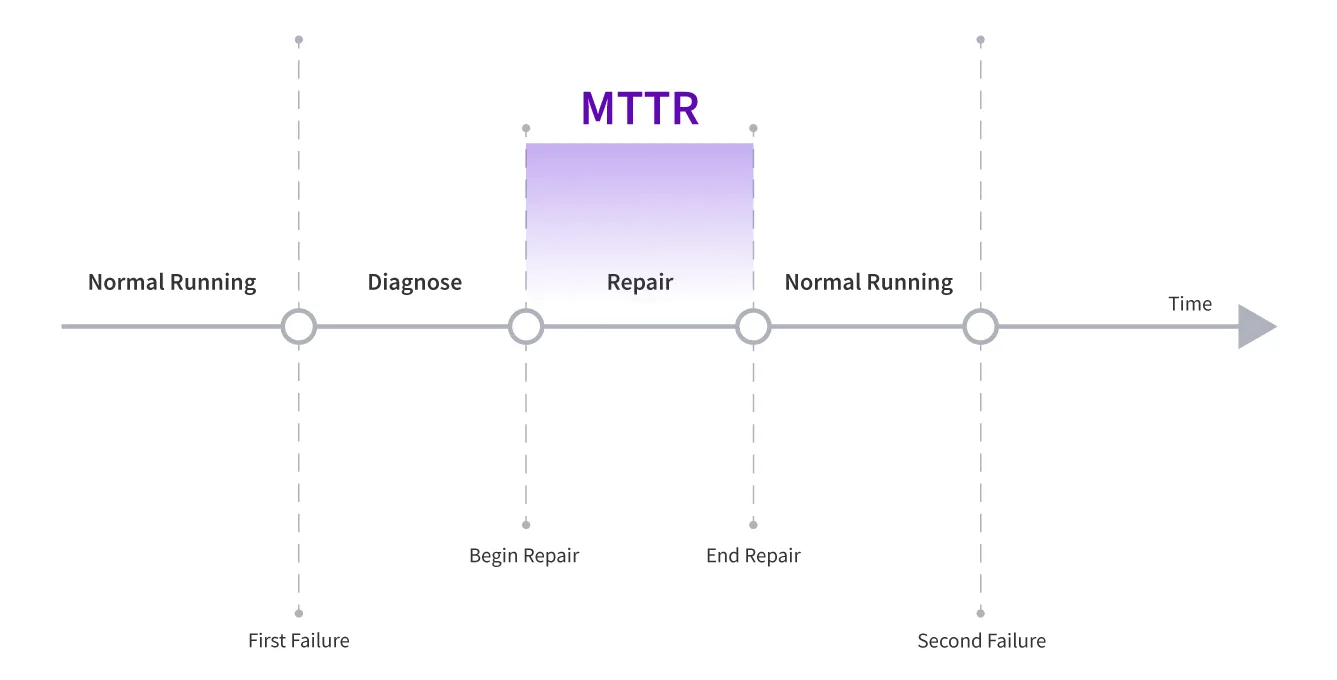
Mean Time to Restore (MTTR): A Practical Guide for Engineering and Technology Leaders
Mean Time to Restore (MTTR) measures the average amount of time it takes for a system or service to recover after a production incident or outage. In simple terms, it reflects how quickly an organization can return to normal operations once something goes wrong.
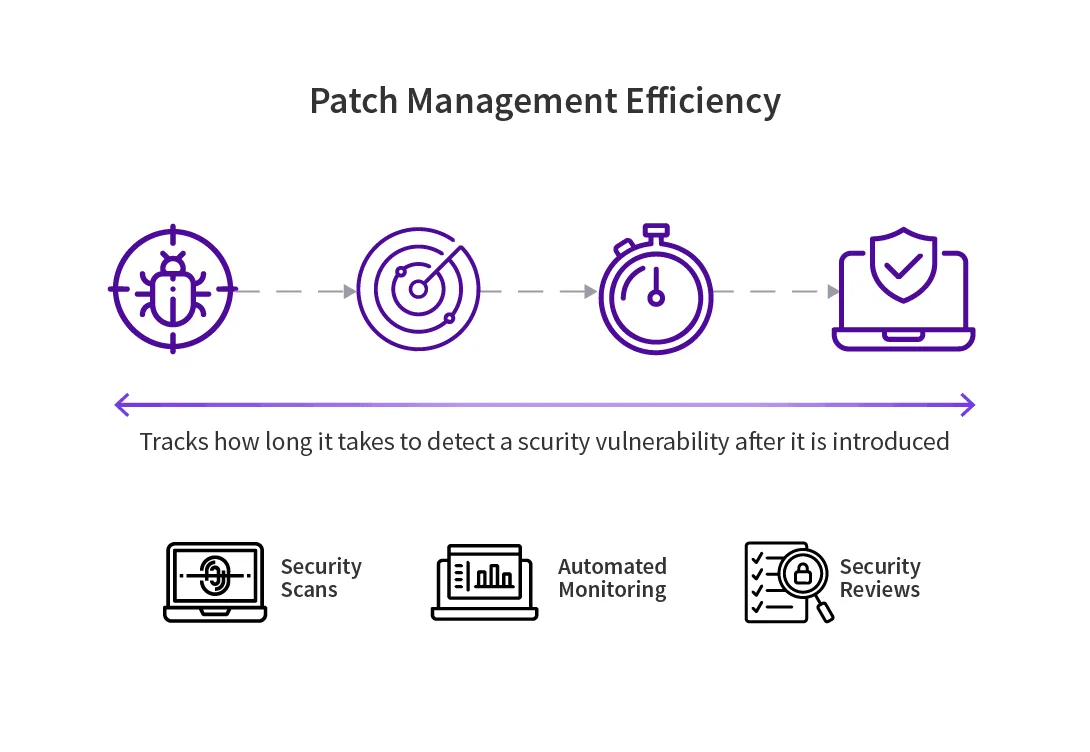
Patch Management Efficiency
What It Is, Why It Matters, and How Organizations Measure It
Pull Request Cycle Time: Mastering The Metric That Defines Engineering Velocity
Transform review efficiency into measurable delivery speed and ignite the momentum of your engineering engine.
Repeat Incident Rate
The metric that tells you whether your incident process is actually working or just generating documentation.
SDLC Flow Velocity
The measure of how much work an engineering team completes and delivers across the full software development lifecycle. A signal for delivery capacity, planning accuracy, and whether the SDLC is producing output at a rate that matches organizational demand.
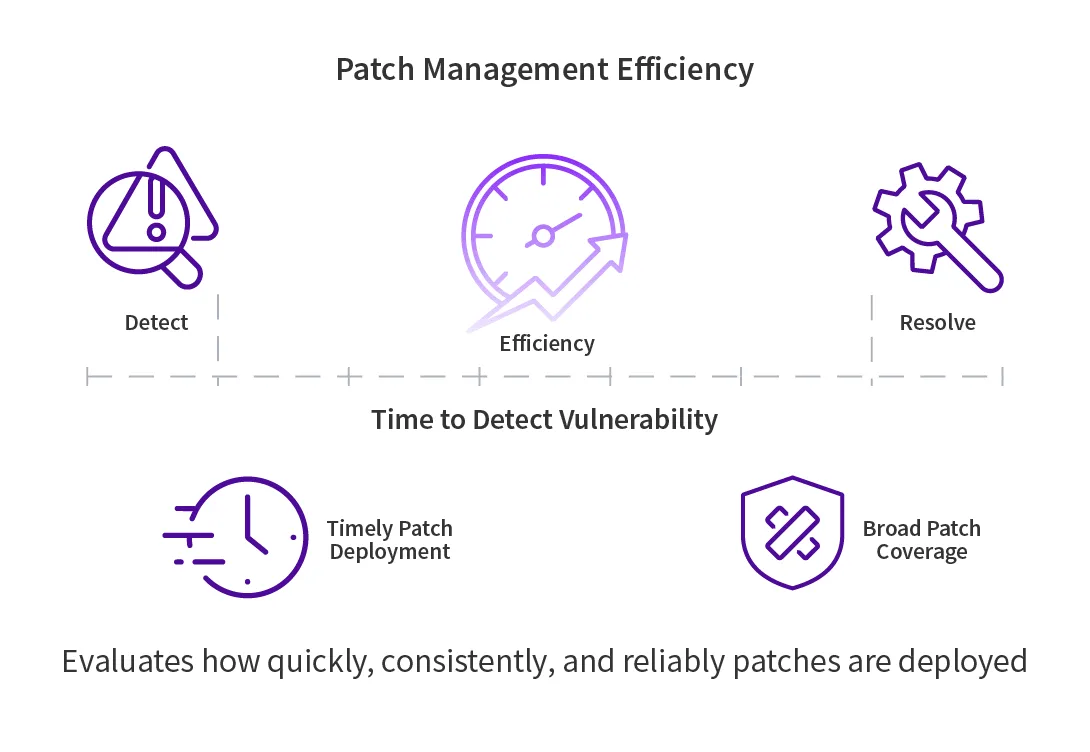
Time to Detect Vulnerability (TTDV)
Time to Detect Vulnerability (TTDV) focuses on how long the team takes to discover the vulnerability after it is introduced into a system.
Time to Mitigate Vulnerability (TTMV)
A Complete Guide to Key DevSecOps Performance Metric
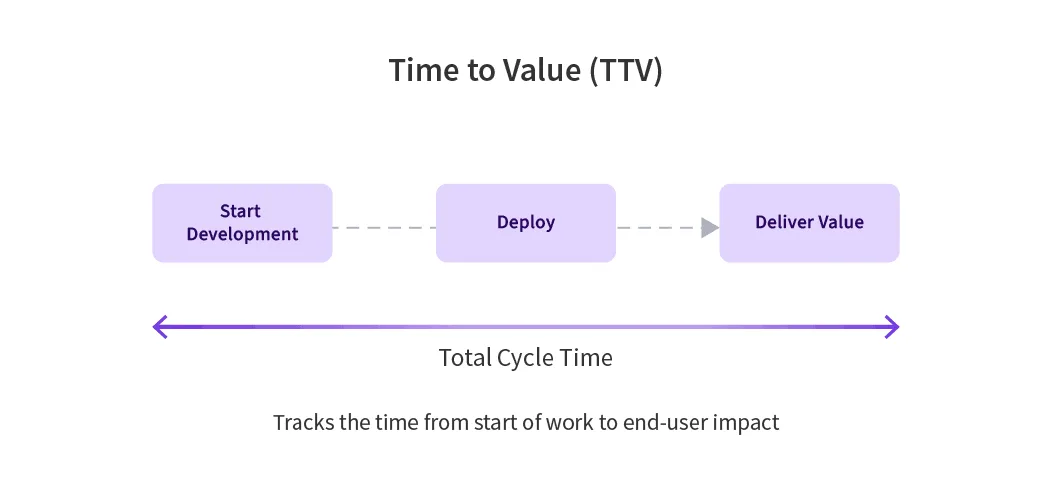
Time to Value
Time to value (TTV) measures how long it takes from when work on a feature begins to when that feature is available and delivering value to end users.
Understanding System Hardening Timelines in DevSecOps Environments
System Hardening Timelines refer to the amount of time required for a newly deployed system or infrastructure component to reach a secure configuration that meets established security standards. The metric focuses on how quickly security controls, configuration policies, and baseline protections…
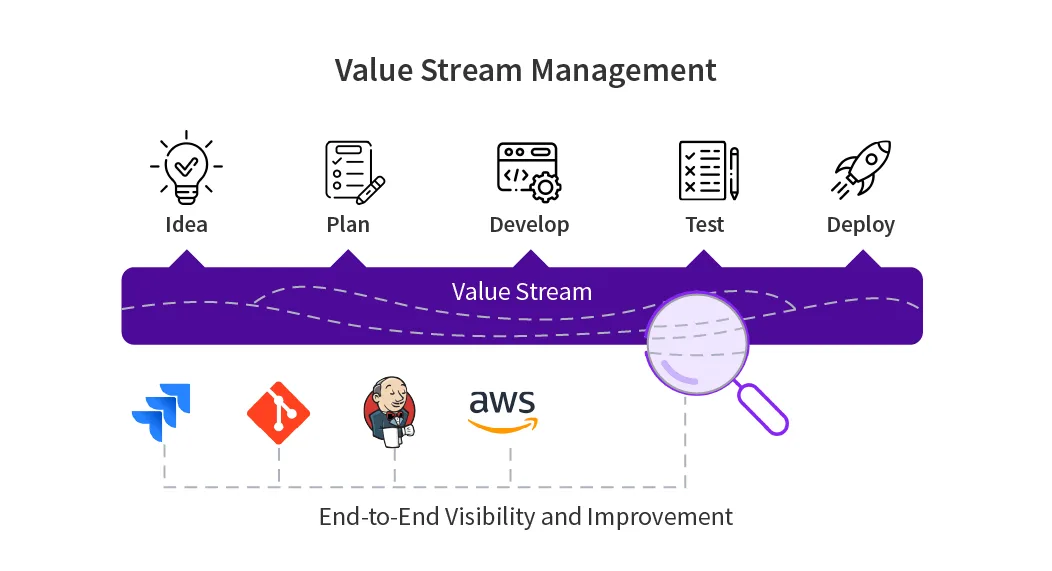
Value Stream Management Explained: From Idea to Customer Value
Value Stream Management (VSM) is a structured approach to understanding how work moves from an initial idea to delivered software in a modern engineering organization. Rather than focusing on a single team or tool, it examines the entire path that value takes across planning, development, testing…
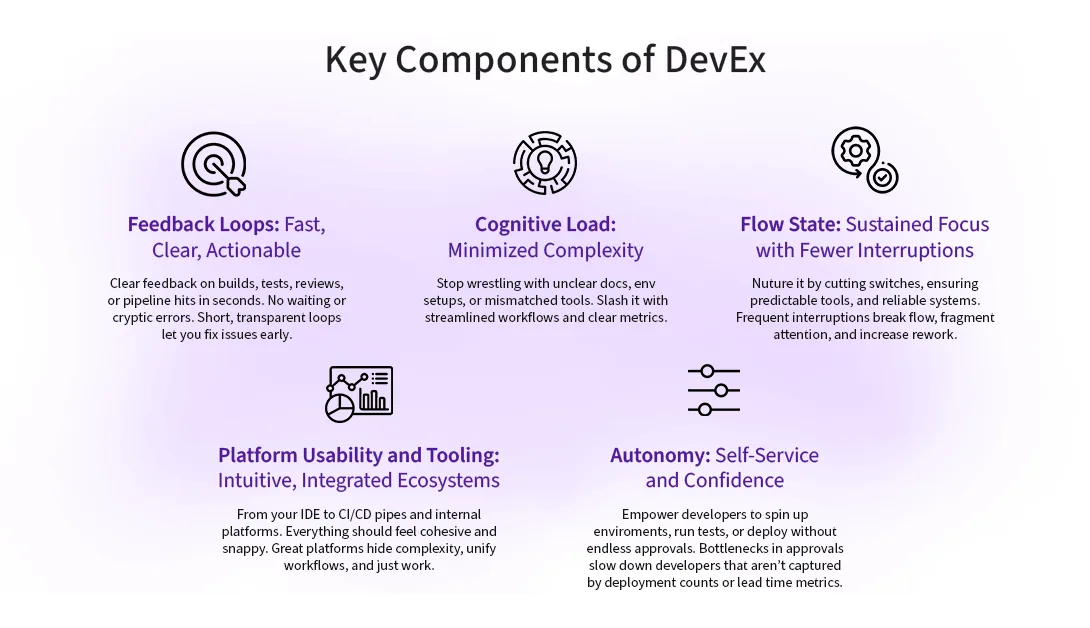
What is Developer Experience (DevEx): A Friendly Guide for Engineers
Ever feel like you're drowning in code reviews, flaky tests, or endless ticket queues while the boss asks, "How's productivity looking?" That's where Developer Experience (DevEx) comes in.

See it running on your own pipelines.
Forty-five minutes with our engineers. Bring a pipeline you are unhappy with.